Maximum Temperature vs. Latitude
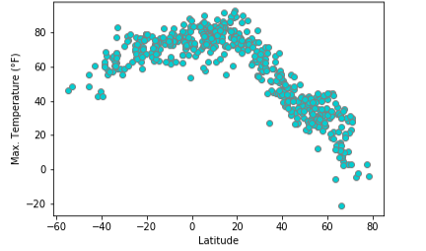
As expected, the maximum temperature grows bigger as the selected city gets closer to the Equator. This plot displays a parabolic trend showing cities in the Southern Hemisphere in the leftmost side, while the cities farthest to the Equator in the Northern Hemisphere will have the most positive latitude values. Further analysis of this dataset should consider maximum temperature as a function of the distance to the Equator regardless of the Hemisphere of the selected city.
Visualizations